Week 4 Practice: Olist E-Commerce Analysis
BUS220 - Business Intelligence and Analytics
Submission Checklist
2 points (satisfactory completion) | Deadline: 3 days after the practice session
Submit one file in Moodle:
Tableau workbook (.twbx) with:
The Scenario
Olist is a Brazilian e-commerce marketplace — a platform that connects small sellers to customers across Brazil. Sellers list products, customers order them, and Olist handles the logistics and payment infrastructure.
You’ve just joined the analytics team. The COO sends you a message:
“We’re preparing for our quarterly review. I need a dashboard that shows how the platform is performing. Can you put something together by end of day?”
“How the platform is performing” could mean a dozen things. The COO didn’t ask for a specific chart. Your job is to translate this vague question into something measurable. But first, you need to understand the data.
Tools & Data
Session 1 uses Syto for data exploration and prep (same tool as week 3). If you prefer Python, R, or another tool — go ahead, the steps are the same conceptually.
Session 2 uses Tableau Public.
Dataset: Olist Brazilian E-Commerce (download from Moodle) — four CSV files:
| File | What it contains |
|---|---|
olist_orders_dataset.csv |
Orders with timestamps and status |
olist_order_items_dataset.csv |
Line items with prices and freight costs |
olist_products_dataset.csv |
Products with categories (in Portuguese) |
product_category_name_translation.csv |
Portuguese → English category names |
Session 1: Explore, Prepare, Plan
Part 1: Get to Know the Data
Import all four CSV files into Syto (each as a separate table).
Use Syto’s EDA panel to profile each table: column types, unique/distinct counts, missing values, value distributions. Click a column header to see its summary statistics.
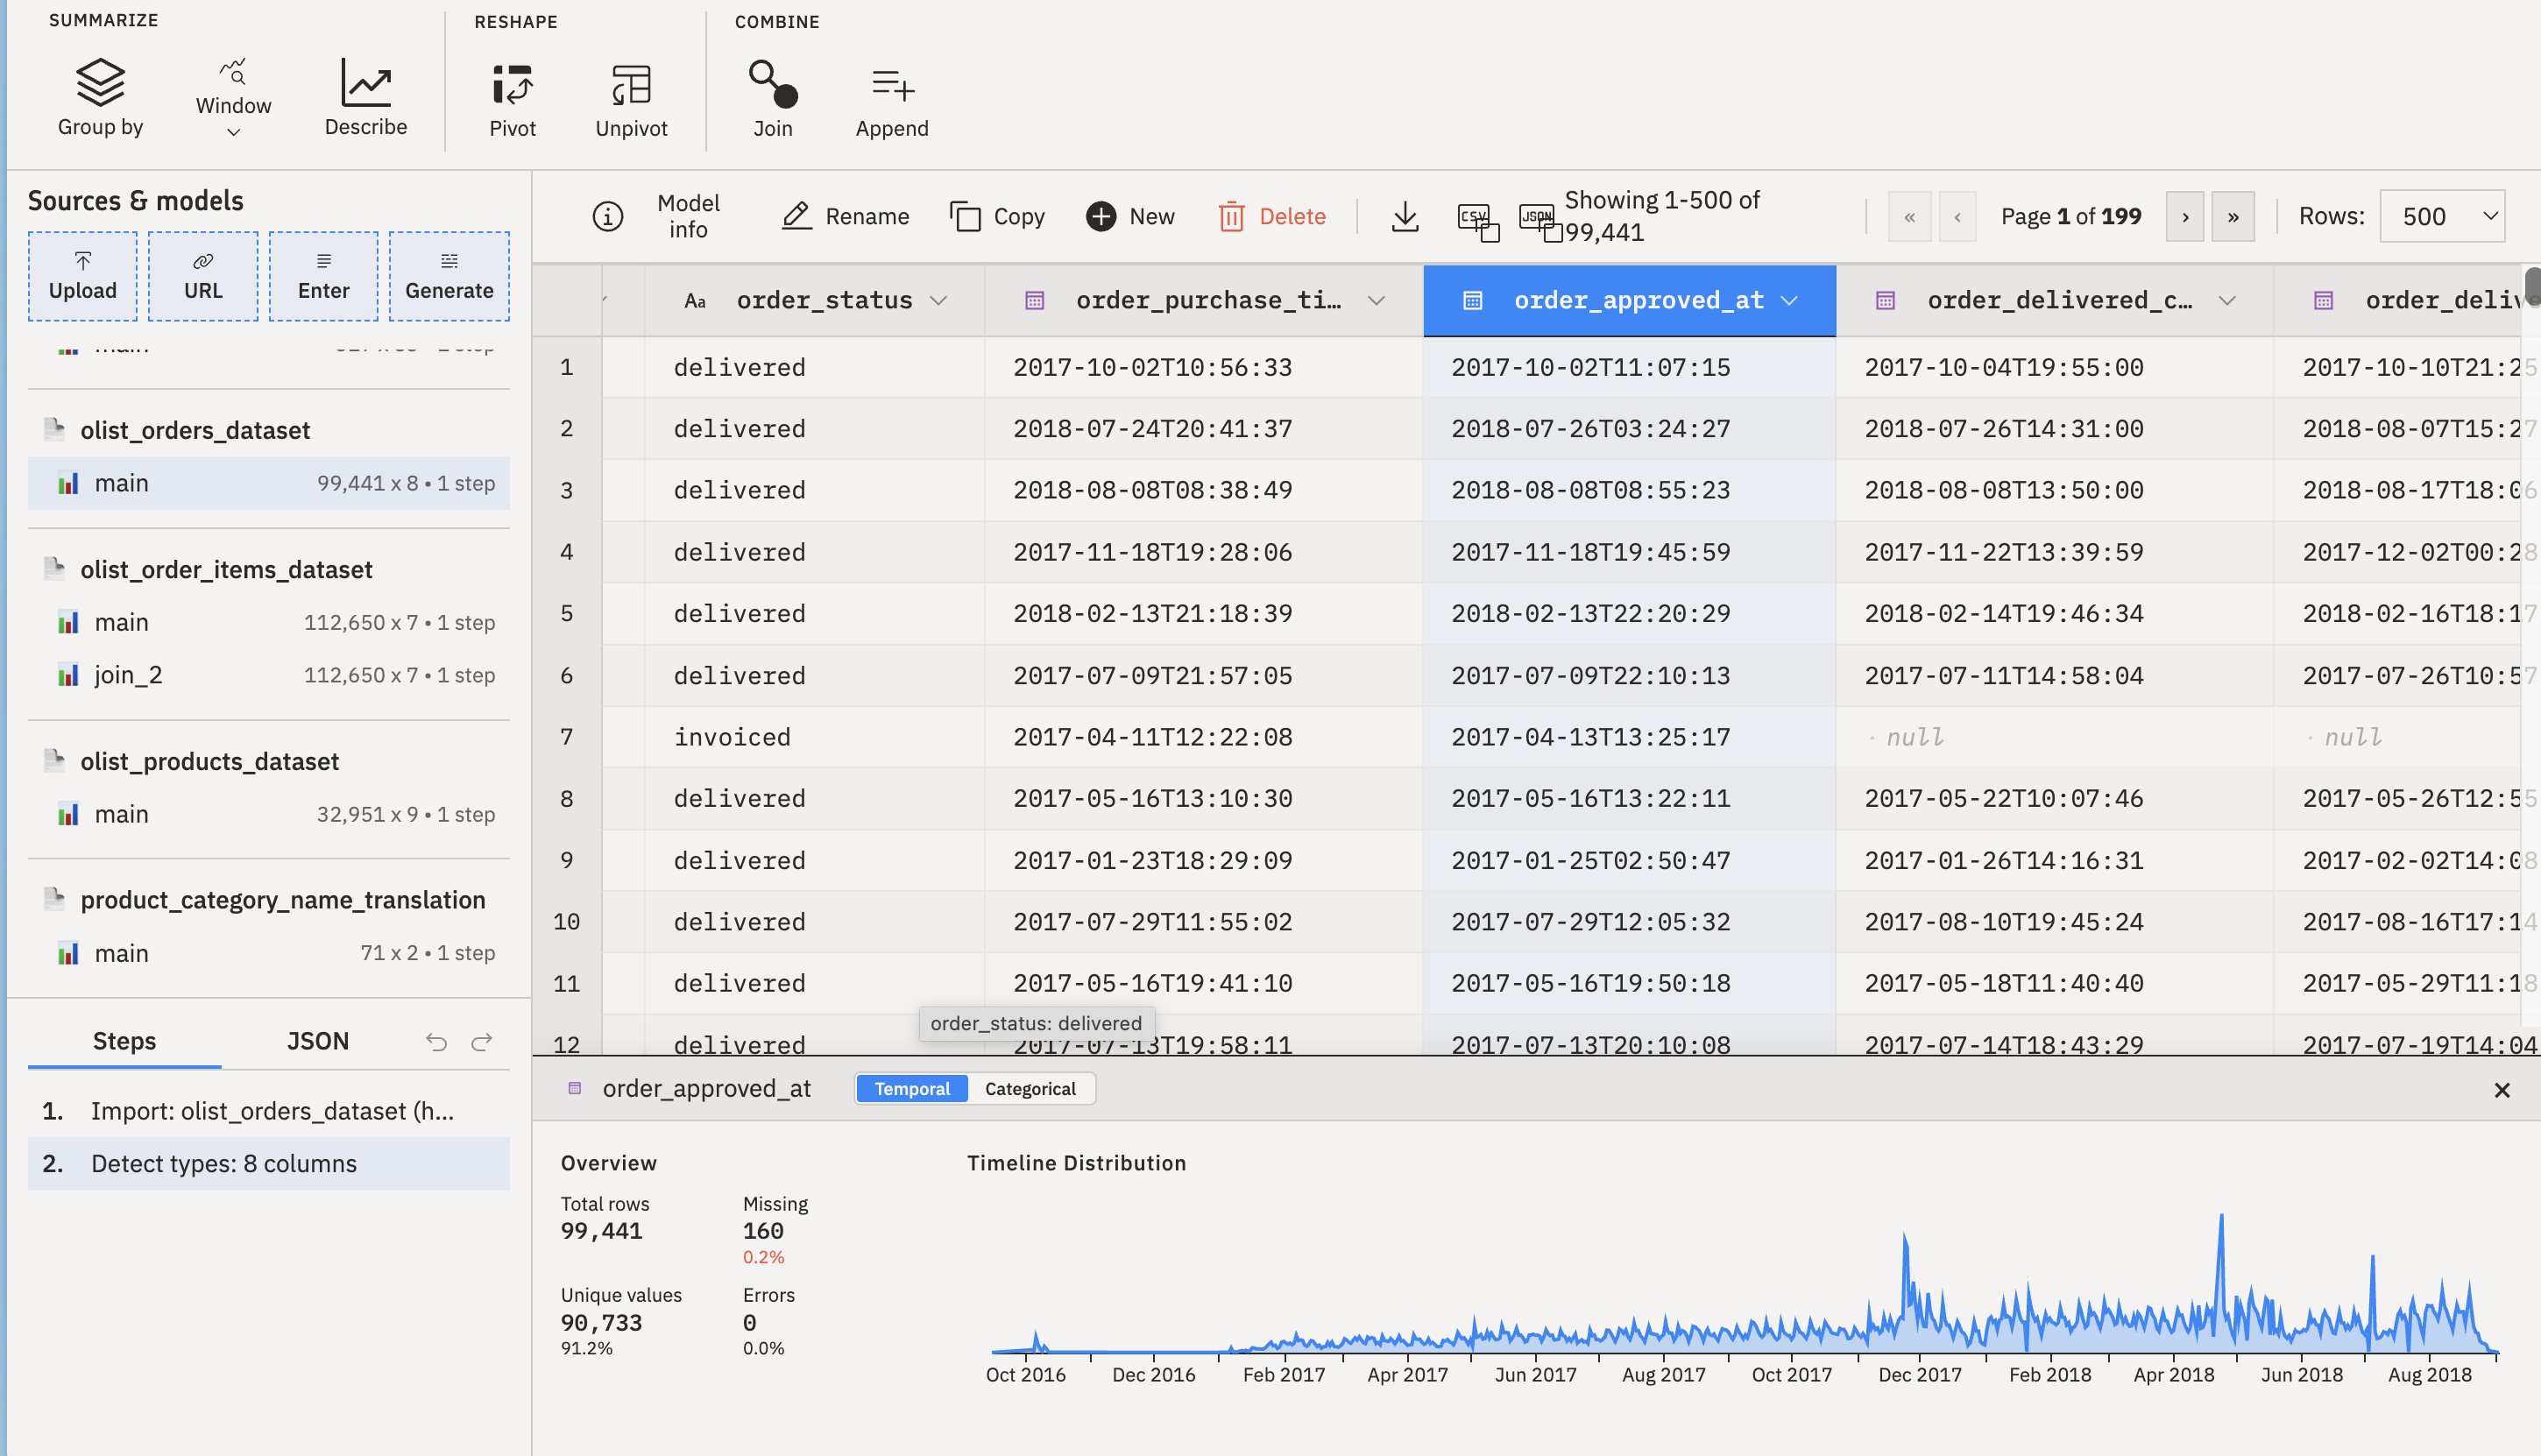
Orders table
- How many rows? How many columns?
- What does each row represent — an order, or something else?
- What’s the date range of
order_purchase_timestamp? - What are the distinct values of
order_status? How many orders are in each status? - How many columns contain dates? What does each one capture?
Order items table
- How many rows? Is this the same as the number of orders?
- How many unique
order_idvalues? If it’s fewer than the row count, what does that tell you? - What’s the range and distribution of
price? Offreight_value? - What is
order_item_id— a global ID or something else? Look at a few orders with multiple items.
Products & translation tables
- How many unique product categories (in Portuguese)?
- How many translations are available? Are there any categories without a translation?
- How many products have no category at all (NULL)?
By the end of this part, you should be able to answer: how many orders are in the dataset? Do all orders have items? What’s the relationship between the orders and order items tables? Are there data quality issues you’ll need to handle?
Part 2: What Should We Measure?
Now that you’ve seen the data, think about the COO’s question. A marketplace has several stakeholders: customers, sellers, and the platform itself.
With your neighbor, brainstorm answers to:
- Revenue & scale: How do we know the platform is growing? What fields support this?
- Logistics: How do we know deliveries are working? Which date columns would you use?
- Customer satisfaction: The dataset doesn’t have a satisfaction survey — but what can you use as a proxy?
Write down 3-5 metrics you’d want on the COO’s dashboard. For each one, ask yourself: compared to what? A number without context is just decoration.
Think about the Lean Analytics reading: is each metric comparative, understandable, a ratio, and behavior-changing? If it fails any of these tests, can you improve it?
Part 3: Prepare the Data
The products table maps product_id to a category name. The translation table maps Portuguese category names to English. Instead of managing four tables in Tableau, attach this product information directly to the order items.
Join product categories onto order items
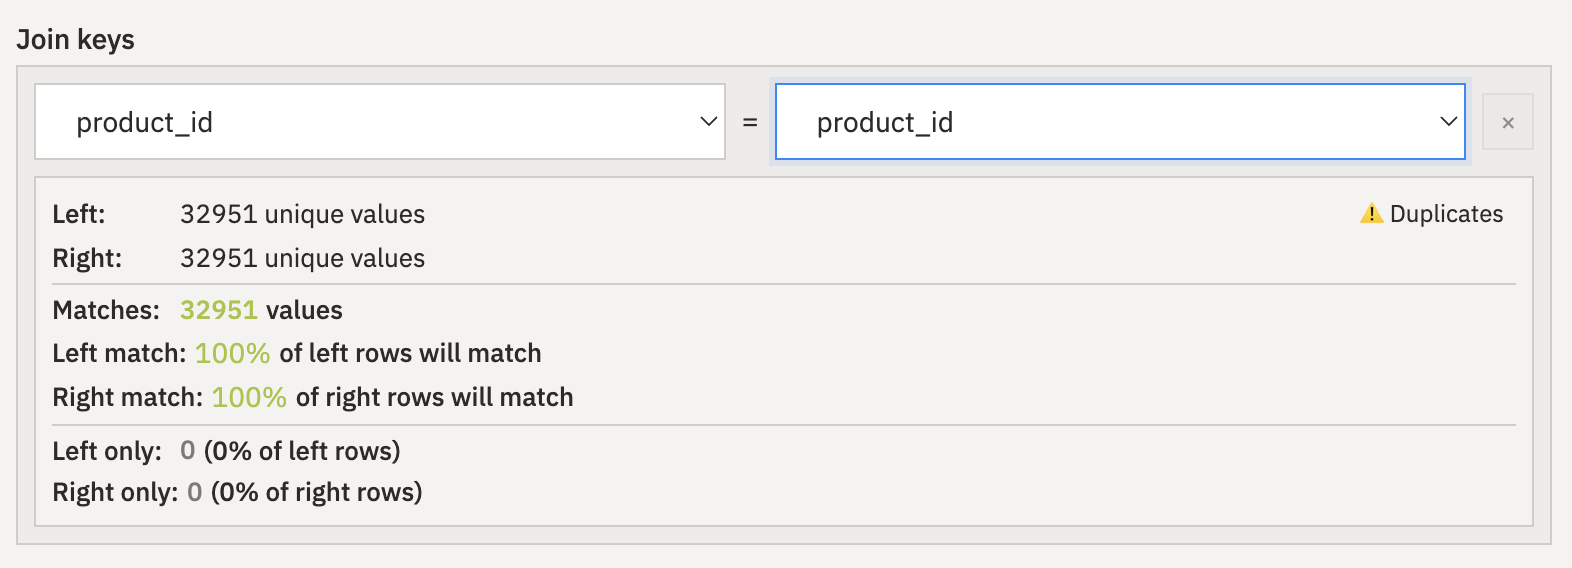
In Syto, join the products table onto order items using product_id as the key. Then join the translation table onto the result using product_category_name.
Before running each join, look at the join preview panel — it shows you how many keys match between the two tables, whether there are duplicates, and how many rows will be left unmatched. This tells you what to expect before you commit.
After the join, each order item row should have the product’s English category name attached. You can drop columns you don’t need (product dimensions, weight) — but keep the Portuguese category name as a fallback for rows where the English translation is missing.
Check: did the row count change? For a lookup join (many-to-one), it shouldn’t. If it did, something went wrong with the key. Also check the new category column — are there NULLs? How many, and why?
Export
Export two clean CSV files:
olist_orders_clean.csv— the orders table as-is (or with any columns dropped that you don’t need)olist_order_items_enriched.csv— order items with product category attached
These are the two files you’ll bring into Tableau.
Session 2: How Are We Doing?
If you didn’t finish Session 1, download the pre-built CSV files from Moodle.
Part 1: Connect in Tableau
Open Tableau Public. Connect to olist_orders_clean.csv, then drag olist_order_items_enriched.csv onto the canvas to create a relationship on order_id.
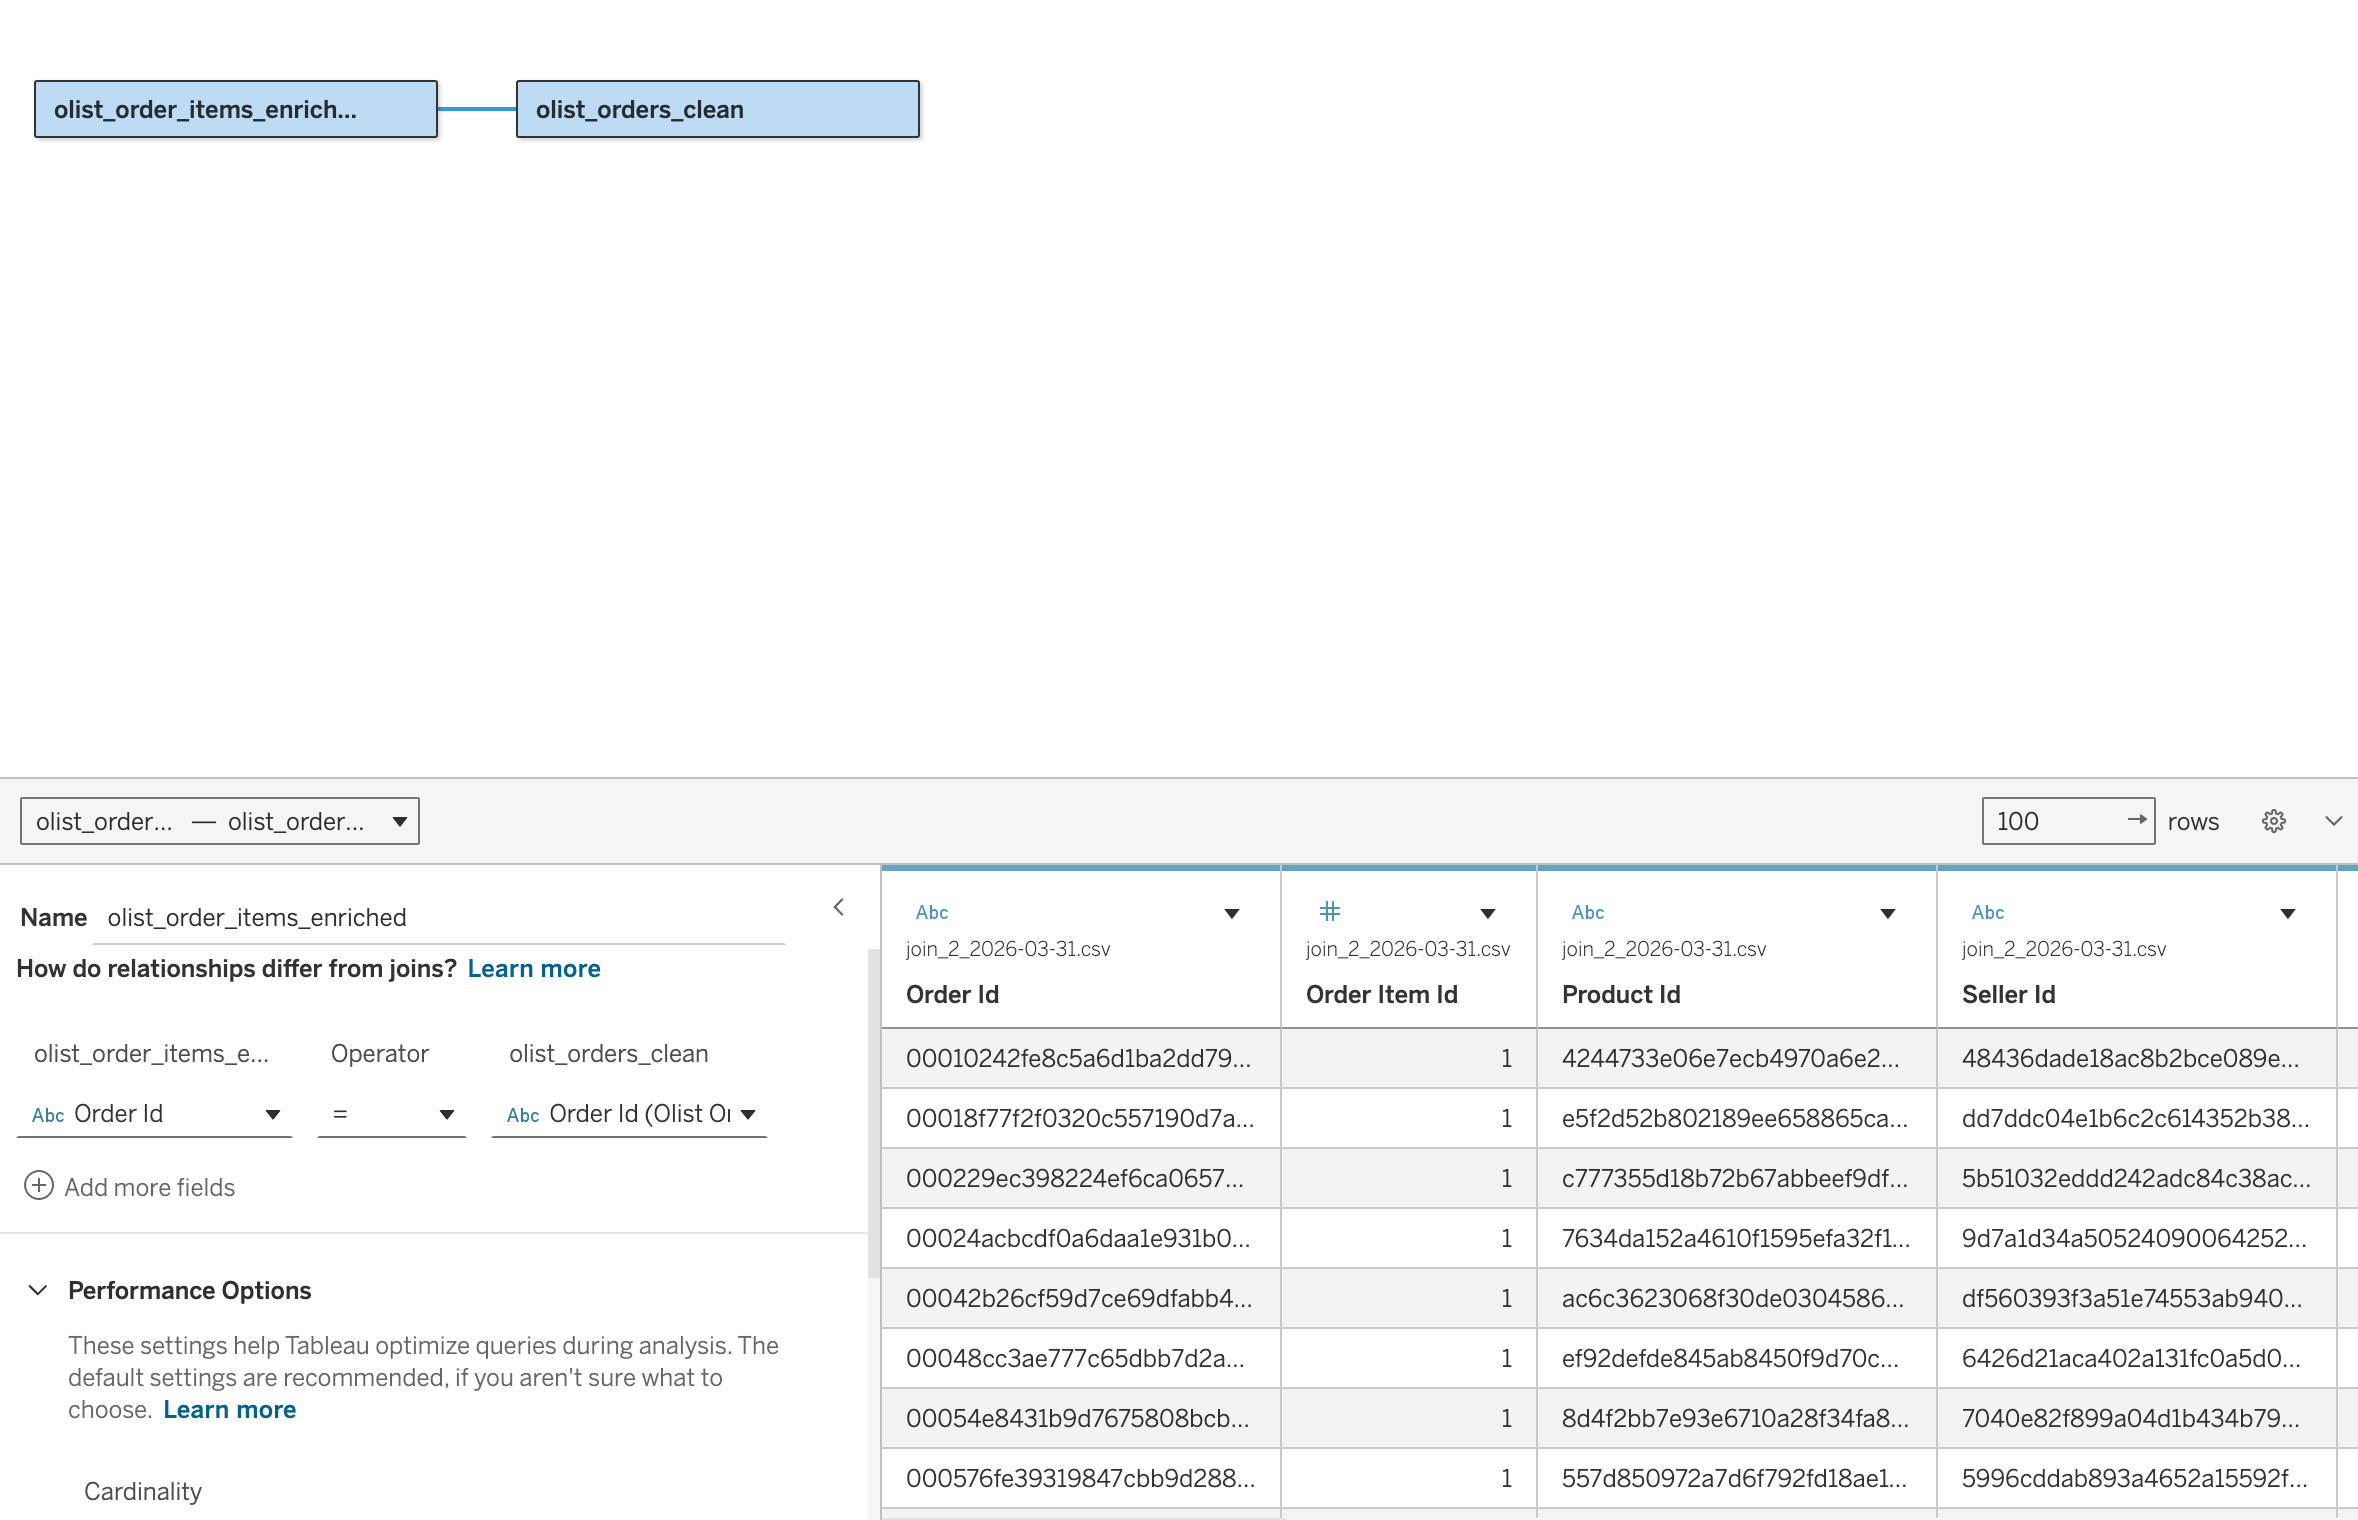
The lecture covered classic joins — inner, left, right, full outer. Tableau’s relationships use those same concepts under the hood, but manage them automatically. With two related tables, Tableau generates the right join and aggregation depending on which fields you use in each view. You won’t see inflated row counts or duplicated totals.
If you want to see the actual join, double-click a table to enter the “physical layer.” For this practice, the default relationship is the right approach.
Quick sanity check: create a worksheet and verify you can access fields from both tables. Try dragging a date field from orders and a measure from order items — they should work together.
Part 2: The First Metric
The COO asked “how are we doing?” What’s the single most important number to answer that? For a marketplace, that’s usually revenue.
Build a bar chart of monthly revenue (SUM(Price) by month of Order Purchase Timestamp). Color the bars by quarter so you can see quarterly patterns at a glance.
Look at the chart. What do you notice?
Pay attention to the most recent quarter. Does it look complete? Check how many months it covers and whether the last month has a full set of days. Incomplete periods will distort your comparison.
Part 3: Make the Comparison Fair
If the latest quarter only has two months, or the last month is cut short, comparing raw totals is misleading. A quarter with 2 months of data will always look worse than one with 3.
Calculate daily revenue instead: SUM([Price]) / COUNTD(DATETRUNC([Order Purchase Timestamp])) or a similar approach that normalizes for the number of days in each period.
Rebuild your chart with this normalized metric. Does the story change?
Now compare quarters: how does Q3 2018 compare to Q2 2018? And how does that trend compare to the same period the previous year? Was the platform growing in 2017? Is it still?
Part 4: What Explains This?
You now have a headline finding for the COO. But “revenue is stagnating” isn’t enough — she’ll ask why. You need supporting charts that break the story down.
Two directions to investigate:
Is it fewer orders or smaller orders?
Build a chart showing unique order count over time (monthly). If order volume is flat or declining, the problem is demand. If orders are steady but revenue is down, the problem is order size or product mix.
Which segments are driving the change?
Break revenue down by a dimension that might explain the trend. Two good candidates:
- Product categories: Build a bar chart of the top categories by revenue. Are the biggest ones growing or shrinking?
- Top sellers: Build a bar chart of the top 10-15 sellers by revenue. Is the platform dependent on a few large sellers?
Pick at least one of these and build a chart. The goal is a view that helps explain the trend you found in Part 3.
Part 5: Assemble the Dashboard
Now combine your charts into a dashboard for the COO. Create a new dashboard and explore the dashboard pane — try different size options, experiment with tiled vs. floating layout.
Think about the reading order. The COO should see:
- The headline number first (revenue trend)
- Then the explanation (order count, category/seller breakdown)
Arrange your worksheets accordingly. Add a title.
Part 6: Make It Interactive
The views on a dashboard should talk to each other. There are two ways to do this:
Filters
Add at least one filter (product category, time period, etc.). Make sure it controls all views on the dashboard — not just the worksheet it came from. Test by selecting a value and confirming everything updates.
Filter actions
You can also make the charts themselves interactive: clicking a bar in one chart filters the other views automatically.
Go to Dashboard > Actions > Add Action > Filter. Set a source worksheet and target all worksheets. Now clicking a mark in one chart filters everything else.
Try it: click a product category bar and watch the revenue trend update to show just that category. Click somewhere else or press Escape to clear.
Experiment with both Filter and Highlight action types — they behave differently. Which one works better for this dashboard?
Part 7: Refine & Submit
- Tooltips: Edit tooltips to show useful context, not every field in the dataset
- Tab names: Rename worksheets from “Sheet 1” to something descriptive
- Colors: Keep color choices consistent across the dashboard
Save your workbook as a .twbx file.
Stretch Goals
If you finish early:
- Add a KPI row at the top with large summary numbers (total revenue, total orders, etc.) — what the Big Book of Dashboards calls “BANs”
- Add the reviews data (
olist_order_reviews_dataset.csv) as a third table related to orders onorder_id - Try a URL action or Highlight action as an alternative interaction style
Takeaways
- Start with the business question, build the first chart that answers it, then let each chart raise the next question
- Incomplete time periods distort comparisons — normalize before concluding
- A dashboard tells a story: headline first, then the explanation
- Filters and filter actions connect the views so the COO can explore on their own