From Data to Decisions
BUS220 - Business Intelligence and Analytics | Week 1
2026-03-11
Welcome to BUS220
Business Intelligence and Analytics
Kyiv School of Economics | Spring 2026
Oleh Omelchenko
o_omelchenko@kse.org.ua
Before we start
A few questions for the room:
- What data courses have you taken so far?
- Have you worked with data outside of coursework?
- What do you expect to get from this course?
What is a “dashboard”?
You see this word everywhere — Tableau, Google Analytics, job postings.
What is it, actually?
Not what tools you use to build one — what is it?
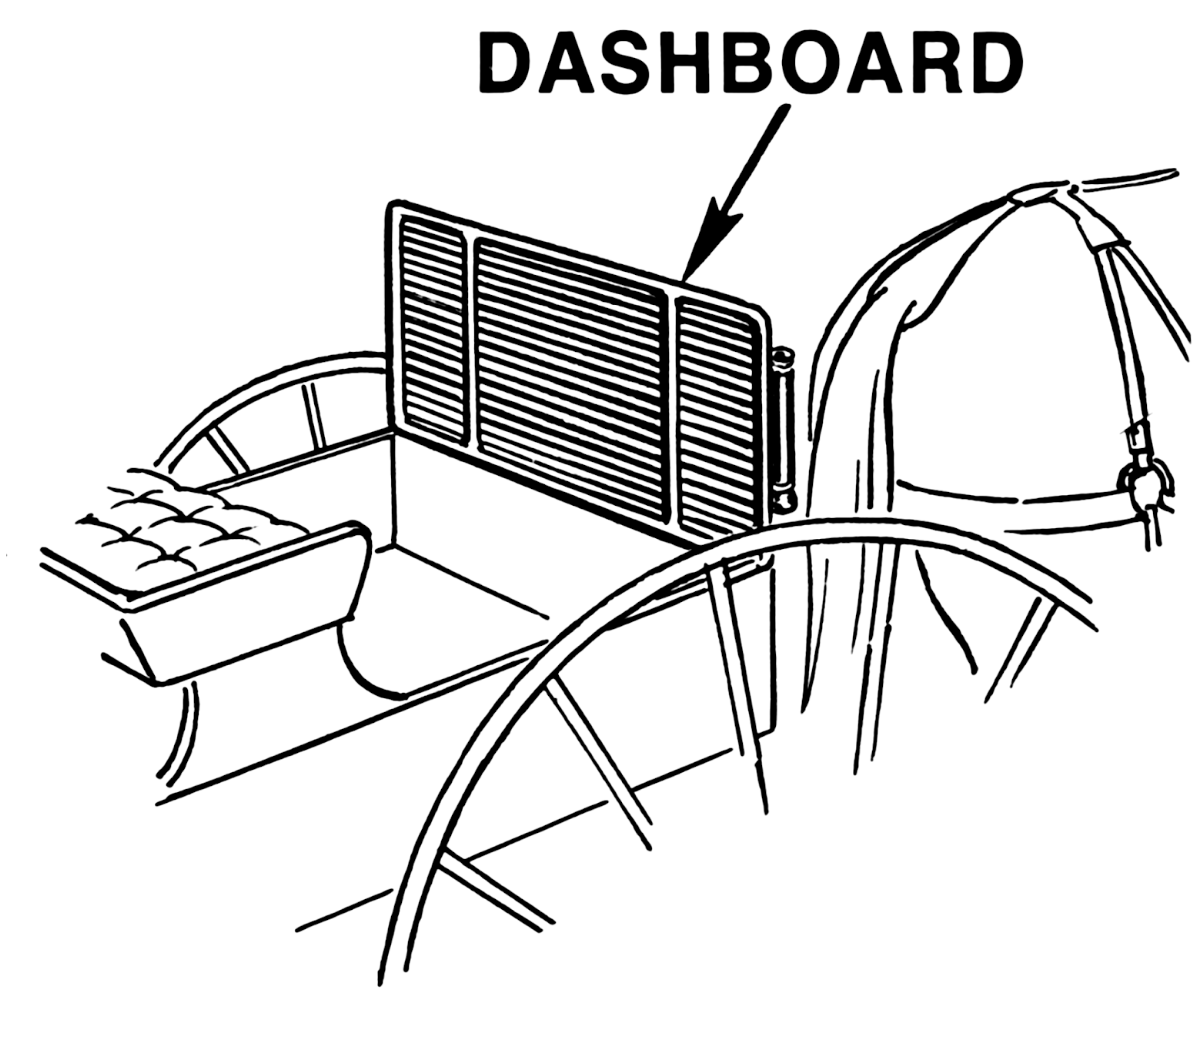
The original dashboard
A board that catches the dash
![]()
A physical board at the front of a horse-drawn carriage.
Its job: protect the driver from mud kicked up by the horses.
“Dash” meant splash or spray. The dashboard caught it.
From mud guard to instrument panel
When cars replaced horses, the board stayed — but the horses were gone.
The board was useless as a barrier. But it was right there in front of the driver.
So engineers started mounting instruments on it: speedometer, fuel gauge, temperature, oil pressure.
What car dashboards teach us
Six design principles that transfer directly to data dashboards.
1. Glanceable, not studyable
![]()
A speedometer gives you the answer in under a second.
You don’t pull over to analyze your speed — you glance.
If you have to think about it, it’s a report, not a dashboard.
2. Context through reference marks
A fuel gauge doesn’t just show a number.
It shows a range from E to F, with color zones.
You know instantly whether the value is good or bad — without remembering what “37 liters” means for your tank.
Dashboards need the same: targets, benchmarks, color coding that tells you “normal” vs “needs attention.”
3. Only the metrics that matter for driving
A car dashboard doesn’t show you engine compression ratios or transmission fluid viscosity.
While driving, you need speed, fuel, temperature, and maybe RPM. Everything else is noise.
The hard part of dashboard design isn’t adding information — it’s deciding what to leave out.
4. Consistent position, always available
Your speedometer is always in the same place. You don’t search for it.
A quick glance left: speed. A quick glance right: fuel. Muscle memory.
Users shouldn’t have to hunt for the number they check every morning.
5. Warnings interrupt, status stays quiet
The check engine light is invisible until something goes wrong.
The speedometer is always visible.
These are two different jobs:
- Ambient — always there, quietly (speedometer)
- Interruptive — hidden until it demands attention (warning light)
6. The driver is not the mechanic
The car dashboard is designed for the driver, not the engineer who built the engine.
A racing car’s dashboard looks nothing like a family sedan’s.
Different audiences need different dashboards — the analyst who builds it is not the manager who uses it.
Dashboard or not?
Now that we have a definition — let’s test it.
Infographic
![]()
Static, designed, tells one story. You read it once. A dashboard you check every morning.
Data story / scrollytelling
The author controls the sequence. A dashboard lets the user control the exploration.
Data art
![]()
Aesthetics and emotional response as the goal, not decisions.
Wind maps, Dear Data postcards, Spotify Wrapped — data as medium, not as decision tool.
From dashboards to BI
So when you said “a page with charts” — you weren’t wrong about what most dashboards are.
But a dashboard that works requires work that happens long before you open Tableau:
- Choosing what to measure
- Cleaning the data
- Understanding the audience
That’s what this course covers — the full pipeline from data to decision.
Where this course fits
The data analysis pipeline
Seven stages from raw data to a decision:
| 1 |
Data acquisition & storage |
Where does the data come from? |
| 2 |
Data cleaning & transformation |
Is the data correct and structured? |
| 3 |
Exploratory analysis |
What patterns exist? |
| 4 |
Metric design & calculation |
What should we measure and why? |
| 5 |
Visualization |
How do we show it effectively? |
| 6 |
Dashboard assembly |
How do we make it interactive? |
| 7 |
Communication & decision support |
What does this mean for the audience? |
Three courses, three focal points
|
|
Data Manipulation
(STAT163)
|
Data Visualization
(STAT230)
|
Business Intelligence
(BUS220 — this course)
|
|
Acquisition
|
|
|
|
|
Cleaning
|
|
|
|
|
Exploratory
|
|
|
|
|
Metric design
|
|
|
|
|
Visualization
|
|
|
|
|
Dashboards
|
|
|
|
|
Communication
|
|
|
|
“Can I get the data
into shape?”
“Can I show this
clearly?”
“Can someone make
a decision from this?”
The question that defines this course
Data manipulation: “Can I get the data into shape?”
Data visualization: “Can I show this clearly?”
Business intelligence:
“Can someone make a decision from this?”
What we won’t cover
- Building data pipelines or ETL code — that’s data engineering
- Machine learning or predictive modeling — that’s data science
- Deep statistical inference — that’s statistics
- Production software — that’s software engineering
We sit in the space between “the data is ready” and “the decision is made.”
The 8-week arc
| 1–2 |
Spreadsheet fundamentals and advanced features |
Data prep & exploratory analysis |
| 3 |
Data cleaning with Syto, Tableau connections |
Data prep → Visualization |
| 4–5 |
Metrics, KPIs, calculated fields, LOD expressions |
Metric design |
| 6–7 |
Interactivity, parameters, design polish |
Dashboard assembly |
| 8 |
Group project presentations |
Communication |
Grading
| Lecture quizzes |
12 |
6 quizzes × 2 pts (Weeks 2–7) |
| Practice submissions |
14 |
7 weeks × 2 pts, completion-based |
| Individual assignments |
50 |
5 × 10 pts (8 technical + 2 documentation) |
| Group project |
35 |
Dashboard + documentation + presentation |
| Total |
111 |
Capped at 100 |
Late policy: 1–7 days = 50% credit, >7 days = not accepted.
Why these tools?
| 1–2 |
Google Sheets |
Most-used analyst tool, teaches patterns that transfer everywhere |
| 3+ |
Syto |
Visual, step-by-step data cleaning in the browser — no install needed |
| 3+ |
Tableau Public |
Industry standard for BI visualization, free, builds on STAT230 |
AI tools policy
Encouraged:
- Using AI to learn concepts and debug formulas
- Generating example code snippets
- Clarifying complex topics
Required: Document all AI usage in assignments
Not accepted: Submitting AI-generated work as your own understanding
I may ask you to explain any part of your submission.
Data quality
What dirty data costs
A dataset has duplicate entries for 8% of customer orders.
Your revenue dashboard shows $5.4M instead of the actual $5.0M.
The marketing team allocates budget based on your numbers.
The dashboard was well designed, the charts were clear, the filters worked — and the decision was still wrong.
The cleaning workflow
Inspect — look at the structure, types, and shape of your data
Identify — find missing values, duplicates, inconsistencies, outliers
Fix — standardize formats, remove duplicates, handle missing data
Validate — check that your fixes didn’t introduce new problems
Same four steps whether you’re in a spreadsheet, Syto, or Tableau’s data source pane.
Tidy data: one rule
Tidy (good)
| Jan |
A |
100 |
| Jan |
B |
200 |
| Feb |
A |
150 |
| Feb |
B |
180 |
Each variable is a column, each observation is a row, each cell holds one value.
Spot the problems
| Ivanova, Maria |
BUS220 |
92 |
2025-09-15 |
| ivanova maria |
bus220 |
A |
15/09/2025 |
| Petrov, Oleksandr |
BUS220 |
85 |
2025-09-15 |
| Petrov, Oleksandr |
BUS220 |
85 |
2025-09-15 |
|
BUS310 |
78 |
Sept 15 |
| Koval, Daryna |
BUS220 |
ninety |
2025-09-15 |
How many issues can you find? Take 30 seconds.
This week’s practice sessions
Practice 1 — Spreadsheet formulas
- Cell references (absolute vs relative)
- Basic functions: SUM, AVERAGE, IF, COUNTIF
Practice 2 — Data cleaning in spreadsheets
- Sorting, filtering, removing duplicates
- Text functions for standardization
- Data validation rules
Submission due within 3 days of the practice session.
Next week
Advanced Spreadsheets — pivot tables, VLOOKUP, INDEX/MATCH, conditional formatting, analytical reports.
Required reading before next lecture:
- SWD Ch1 — The Importance of Context (audience, the Big Idea)
- SWD Ch2 — Choosing an Effective Visual (tables, graphs, what to avoid)
Week 2 starts with Quiz 1 covering this week’s material and readings.
Summary
We started with a question: what is a dashboard?
A dashboard is just the surface — the last step.
This course covers everything underneath:
cleaning data, choosing metrics, designing for a specific audience.
By Week 8, you’ll present a dashboard that someone could actually use to make a decision.
Office hours: Wednesday 16:00–18:00 | Slack