BUS220 - Business Intelligence and Analytics | Week 3
Oleh Omelchenko
2026-03-25
Data has shape
What did the pivot table do?
You had 10,000 order rows. To make a multi-series line chart, you built a pivot table.
Before (long):
Quarter
Region
Sales
2014-Q1
Central
$8,601
2014-Q1
East
$12,340
2014-Q1
South
$6,209
2014-Q1
West
$9,734
2014-Q2
Central
$11,082
…
…
…
⟶
After (wide):
Quarter
Central
East
South
West
2014-Q1
$8,601
$12,340
$6,209
$9,734
2014-Q2
$11,082
…
…
…
…
…
…
…
…
The pivot table is a data reshaping operation
The pivot table changed your data’s shape.
Values from the Region column became column headers.
This shape is called wide format: compact, human-readable, one row per time period.
The original shape is called long format: one observation per row, each variable in its own column.
Where does this idea come from?
In 2014, Hadley Wickham — a New Zealand statistician at Rice University — published a paper formalizing something practitioners had been doing informally.
He noticed every analysis project started with the same struggle: reshaping data before the actual analysis could begin. The target shape was always the same.
He called it tidy data. Three rules:
Each variable is a column
Each observation is a row
Each type of observational unit is a table
Wickham’s “Tidy Data” paper (2014)
Wickham translated a 1970 idea
In 1970, Edgar Codd published the rules of relational database design — including third normal form: store each fact once, in the right place.
Wickham references Codd directly in his paper. Tidy data is third normal form, repackaged for people who work in R and spreadsheets instead of databases.
Community
They call it
Database engineers
Third normal form
Statisticians
Tidy data
BI practitioners
Star schema
Wickham’s contribution was making the idea accessible outside the database world.
You’ve already seen a star schema
The Superstore spreadsheet had three sheets, connected by lookups.
erDiagram
    Orders ||--o{ People : "Region"
    Orders ||--o{ Returns : "Order ID"

    Orders {
        string Order_ID
        date Order_Date
        string Region
        string Product
        float Sales
        float Profit
        float Discount
        int Quantity
    }
    People {
        string Region
        string Manager
    }
    Returns {
        string Order_ID
        string Returned
    }
Star schema = one central fact table (the transactions, the measurements) surrounded by smaller dimension tables (the context: who, where, what category).
The XLOOKUP you wrote in week 1 was a manual join between a fact table and a dimension table.
Exercise: which shape is this?
A grade book
Student
HW1
HW2
Midterm
Final
Anna
85
92
78
88
Boris
91
87
94
90
Clara
73
80
85
82
Wide or long?
Wide. “Assignment” is a variable stuffed into column headers. To use this in Tableau, you’d unpivot HW1/HW2/Midterm/Final into an “Assignment” column and a “Score” column.
A bank transaction log
Date
Account
Amount
Type
Mar 1
Checking
-45.00
Purchase
Mar 1
Checking
2,500.00
Salary
Mar 2
Savings
500.00
Transfer
Wide or long?
Long (tidy). Each transaction is one row. Each variable is one column.
Why tools matter
What happens when spreadsheets aren’t enough.
Excel renames your genes
Genomics researchers work with gene names like SEPT1 (Septin 1), MARCH1 (Membrane Associated Ring-CH-Type Finger 1), DEC1 (Deleted in Esophageal Cancer 1).
Open a CSV with these names in Excel:
SEPT1 → September 1
MARCH1 → March 1
DEC1 → December 1
No warning. No error message. Silent data corruption.
Excel silently converts gene names to dates
20% of genomics papers had corrupted gene names
A 2016 study by Ziemann, Eren, and El-Osta screened 3,597 published papers with supplementary Excel files.
704 papers — roughly one in five — contained gene names that had been silently converted to dates or floating-point numbers by Excel.
In 2020, the Human Gene Nomenclature Committee gave up on fixing the software. They renamed 27 human genes instead.
SEPT1 → SEPTIN1. MARCH1 → MARCHF1.
They renamed parts of the human genome because they couldn’t get scientists to stop opening CSVs in Excel.
Invisible formulas, real consequences
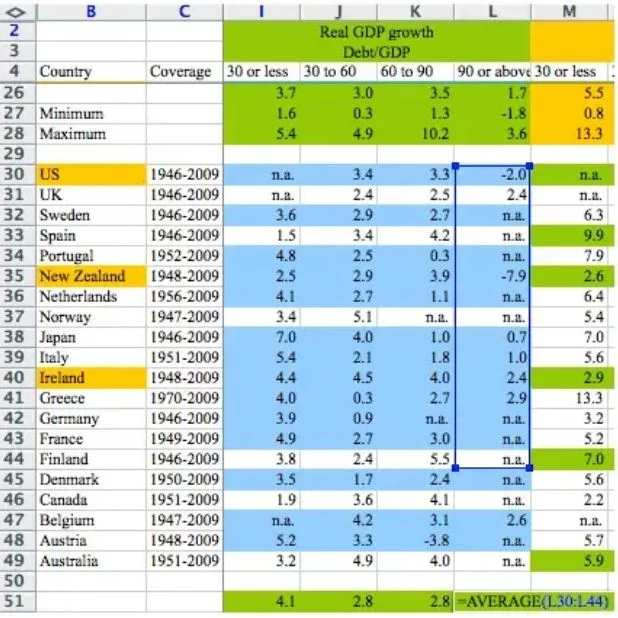
In 2010, Harvard economists Reinhart and Rogoff published a paper arguing that countries with debt above 90% of GDP experience negative growth.
The paper was cited in Congressional hearings, European Parliament debates, and IMF policy documents to justify austerity measures.
Three years later, a graduate student found a SUM formula that excluded five rows — Belgium, Austria, Australia, Canada, and Denmark were missing from the average.
With all countries included, the result flipped: slow but positive growth.
Reinhart-Rogoff spreadsheet error
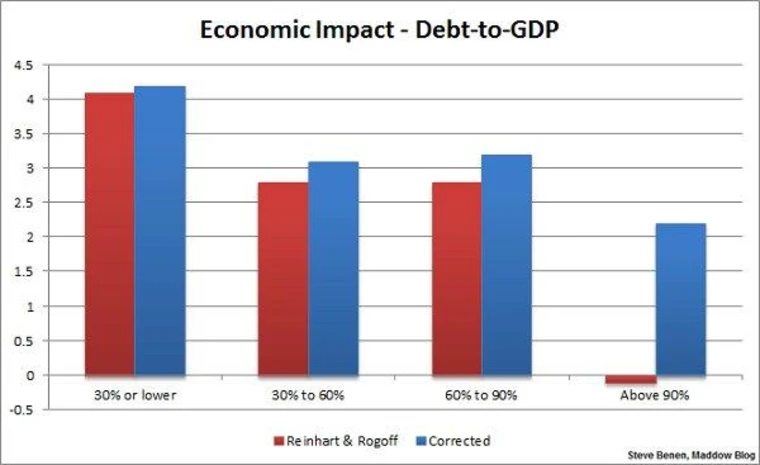
The corrected results
Reinhart-Rogoff: original vs. corrected GDP growth by debt level
The “above 90%” group changed the most: from −0.1% to +2.2% average growth. The formula error didn’t just nudge the number — it flipped the sign.
But tools aren’t the only problem
Even if your tool is perfect, the data itself arrives broken.
What problems can you spot?
id
date
city
category
amount
notes
1
2025-03-01
Kyiv
Electronics
1200
2
03/04/2025
Kiev
electronics
$800
returned
3
2025-03-01
Kyiv
Electronics
1200
4
2025-03-12
Clothing
0
5
01/04/2025
kyiv
Other
350
6
2025-03-20
Київ
Electronics
2,100
Duplicated rows
id
date
city
category
amount
notes
1
2025-03-01
Kyiv
Electronics
1200
2
03/04/2025
Kiev
electronics
$800
returned
3
2025-03-01
Kyiv
Electronics
1200
4
2025-03-12
Clothing
0
5
01/04/2025
kyiv
Other
350
6
2025-03-20
Київ
Electronics
2,100
Rows 1 and 3 are identical. Is this a real duplicate, or two separate transactions that happen to match?
If you sum the amount column, you get an extra 1,200 — or you lose a real sale.
Inconsistent dates
id
date
city
category
amount
notes
1
2025-03-01
Kyiv
Electronics
1200
2
03/04/2025
Kiev
electronics
$800
returned
3
2025-03-01
Kyiv
Electronics
1200
4
2025-03-12
Clothing
0
5
01/04/2025
kyiv
Other
350
6
2025-03-20
Київ
Electronics
2,100
Two formats in one column. Rows 1, 3, 4, 6 use YYYY-MM-DD. Rows 2 and 5 use MM/DD/YYYY — or is it DD/MM/YYYY?
Is row 5 January 4th or April 1st? Without knowing who entered it, you can’t tell.
Inconsistent spelling
id
date
city
category
amount
notes
1
2025-03-01
Kyiv
Electronics
1200
2
03/04/2025
Kiev
electronics
$800
returned
3
2025-03-01
Kyiv
Electronics
1200
4
2025-03-12
Clothing
0
5
01/04/2025
kyiv
Other
350
6
2025-03-20
Київ
Electronics
2,100
Four spellings of the same city: Kyiv, Kiev, kyiv, Київ.
A GROUP BY city gives you four groups instead of one. Every aggregate — total, average, count — is silently wrong.
Missing and disguised values
id
date
city
category
amount
notes
1
2025-03-01
Kyiv
Electronics
1200
2
03/04/2025
Kiev
electronics
$800
returned
3
2025-03-01
Kyiv
Electronics
1200
4
2025-03-12
(blank)
Clothing
0
5
01/04/2025
kyiv
Other
350
6
2025-03-20
Київ
Electronics
2,100
Row 4: city is blank — was it not recorded, or is this an online order with no city?
Row 4: amount is 0 — is this a free item, or does 0 mean “not yet invoiced”?
Mixed types and formatting
id
date
city
category
amount
notes
1
2025-03-01
Kyiv
Electronics
1200
2
03/04/2025
Kiev
electronics
$800
returned
3
2025-03-01
Kyiv
Electronics
1200
4
2025-03-12
Clothing
0
5
01/04/2025
kyiv
Other
350
6
2025-03-20
Київ
Electronics
2,100
$800 and 2,100 are text strings, not numbers. A SUM formula skips them silently.
Electronics vs. electronics — same category or different? Other — what does that even mean?
Six rows, six problems
Problem
Rows
Risk
Duplicated rows
1, 3
Inflated totals
Inconsistent dates
2, 5
Wrong time series
Inconsistent spelling
1, 2, 5, 6
Broken grouping
Missing values
4
Wrong aggregates
Numbers as text
2, 6
Silent calculation errors
Meaningless categories
5
Lost information
This was 6 rows. Real datasets have thousands.
Fixing these problems one cell at a time doesn’t scale. You need a process that’s systematic and reproducible.
Pipelines instead of spreadsheets
A data preparation tool separates data from logic. Every transformation is an explicit, named step.
import
→
filter
→
rename
→
convert types
→
derive
→
export
If step 3 is wrong, you fix step 3 — steps 4 through 8 rerun automatically.
If a column is typed as text, it stays text. No silent date conversions.
Every BI platform has a data prep tool
Platform
Data prep tool
Cost
Power BI
Power Query
Included with Power BI
Tableau
Tableau Prep
~$70/month (on top of Tableau Creator)
Python
pandas
Free, but you write code
Browser
Syto
Free
The concept is the same in all of them: a visual pipeline where each step is an explicit transformation you can inspect and reorder.
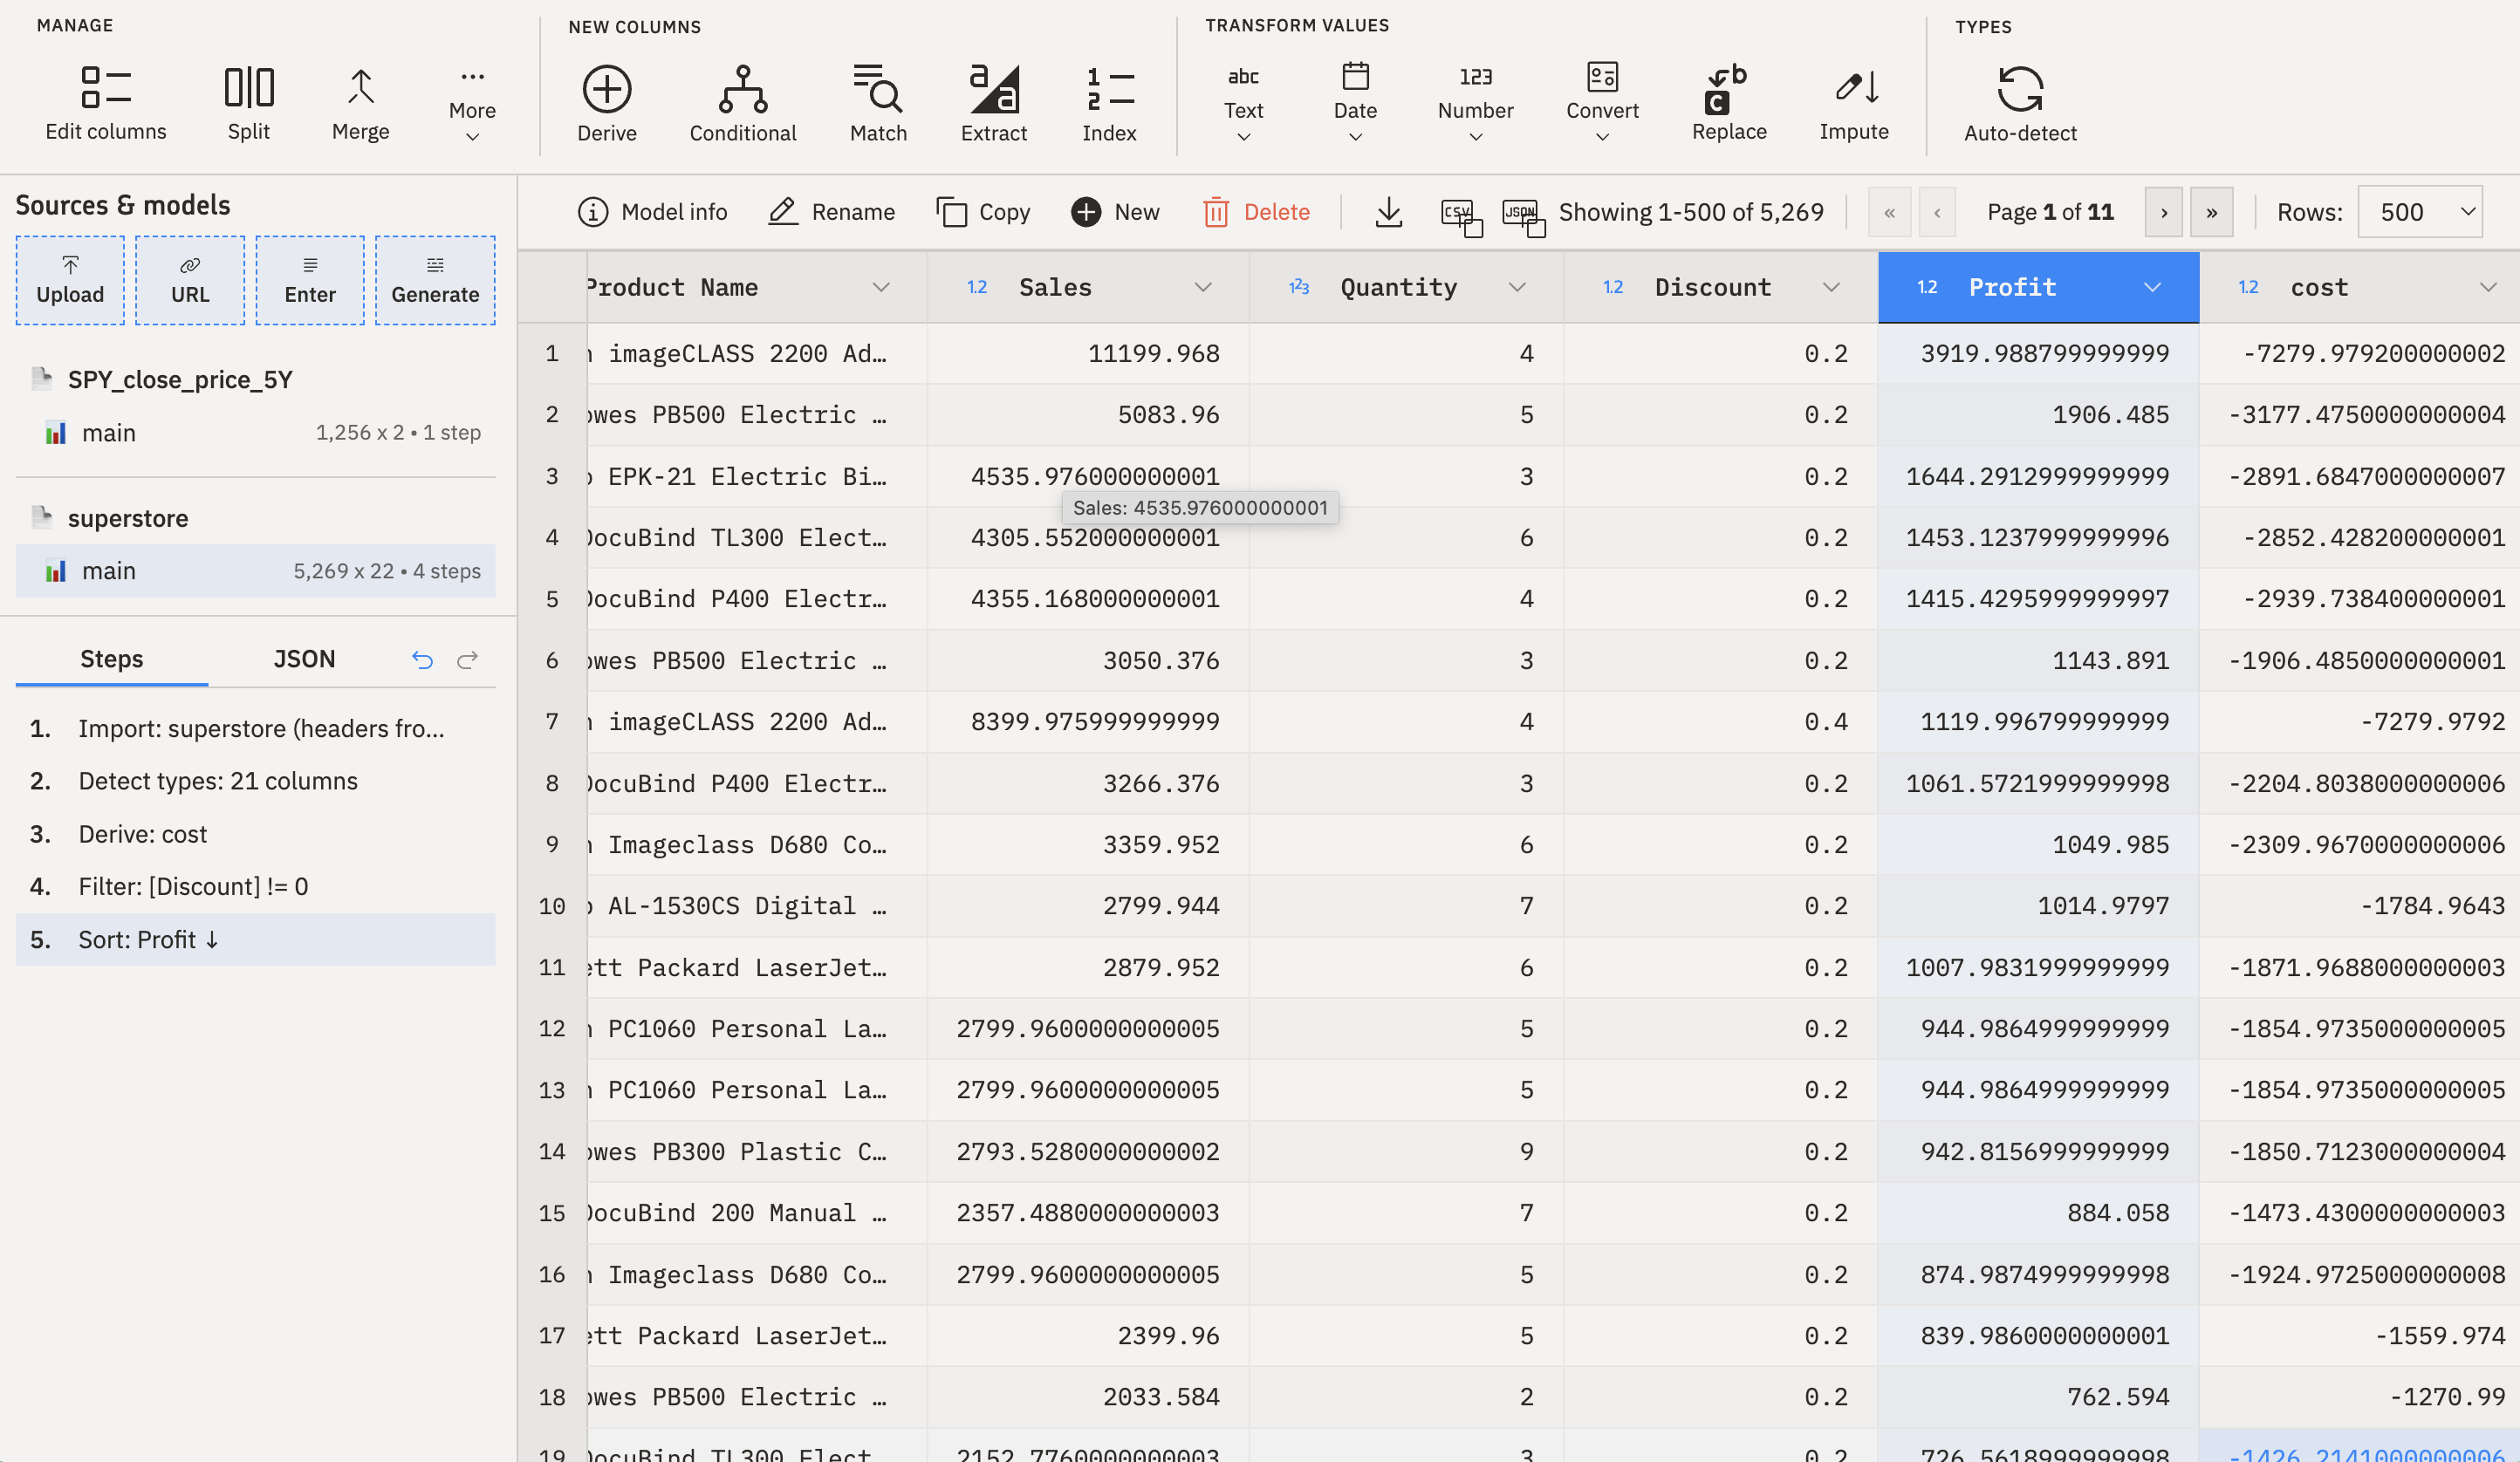
Syto
Browser-based — no installation, works on any OS
Visual pipeline — each transformation is a named step you can reorder, edit, or remove
Exports clean CSV — which you then connect to Tableau
It’s free, it’s visual, and it teaches the same concepts you’d use in Power Query or Tableau Prep.
The skill transfers: once you understand pipeline thinking, switching tools is learning new syntax for the same operations.
Syto interface with pipeline steps
Live demo: cleaning data in Syto
Tableau’s data model
How Tableau understands your data — the layer underneath the charts.
Live demo: connecting data in Tableau
Dimensions vs. measures
[Screenshot: Tableau Data pane for billboard-long.csv — Dimensions section (artist, genre, track, date_entered) above the line, Measures section (rank, week) below the line]
Dimensions answer what
What artist?
What genre?
What date?
Drag to Rows → one row per unique value
Measures answer how much
What rank?
How many weeks?
What sales amount?
Drag to Columns → Tableau aggregates (sums, averages, counts)
Discrete vs. continuous
Blue pill Discrete — separate buckets Tableau draws a header for each value Good for: categories, individual years, distinct groups
Green pill Continuous — an unbroken range Tableau draws an axis Good for: time series, numeric ranges, quantities
[Screenshot: Same date field shown two ways — top: discrete YEAR(date_entered) with separate column headers “1999” “2000”; bottom: continuous date_entered as a time axis flowing left to right]
The shortcut: blue = headers, green = axis. The same field can be either — you choose.
The Marks card: pre-attentive attributes in Tableau
[Screenshot: Tableau Marks card showing Color, Size, Shape, Detail, Tooltip]
Pre-attentive attributes — color, size, shape — are the channels the brain processes fastest.
In Tableau, these live on the Marks card. Drag a field to Color, Size, or Shape to encode data through that visual channel.
Live demo: the automatic pivot in action
What’s ahead in practice
Practice this week
P1 — Data wrangling in Syto
Take the Billboard Hot 100 dataset: 317 songs, 76 weeks of rankings, crammed into 79 columns. Unpivot the 76 week columns into rows, clean the results, export two files at two granularity levels.
This is literally Table 5 from Wickham’s tidy data paper.
P2 — First steps in Tableau
Connect both cleaned files. Build worksheets from each — line charts from the song-week data, bar charts and histograms from the song-level data.
[Screenshot: The raw billboard-raw.csv opened in a spreadsheet — showing the 79-column structure with x1st.week through x76th.week columns stretching off-screen to the right. The “this is untidy” moment.]
Three ideas to take with you
Data has shape. Wide and long are two layouts for the same information. Pivot goes long → wide. Unpivot goes wide → long.
Tableau pivots for you. Give it tidy data and it handles grouping, aggregation, and visual separation automatically.
Granularity determines meaning. The same drag-and-drop produces insight or garbage depending on whether the data level matches the question.