BUS220 - Business Intelligence and Analytics | Week 7
Oleh Omelchenko
2026-04-22
Week 7 is a project week
What this week covers
No new Tableau mechanics this week. Instead:
A framework for the whole arc from business question to presented story
Tactics for the group project presentation
A self-audit and peer review in practice
You’ve spent six weeks learning to build dashboards. Nobody has shown you how to present them yet. Let’s fix that.
The project, briefly
Each group gets one city and two quarterly Airbnb scrapes (~80 columns per listing: pricing, host profiles, reviews, availability, location, licensing). Each member picks one analytical area and builds one dashboard page for it.
Pricing & Value
What drives pricing in this city’s rental market?
Host Profiles & Market Structure
Who runs this market — casual hosts or commercial operators?
Guest Experience & Reviews
What does the review data reveal about satisfaction and seasonal demand?
Geography & Regulation
How is the market distributed, and what does regulation look like?
You’ll hand in a Tableau workbook (KPI overview + one page per area), a written analysis, and a live presentation where each member defends their own area.
After a presentation, people remember
63%
of the stories
5%
of the statistics
From Made to Stick by Chip and Dan Heath. If you remember one thing from today, make it this.
Sizzle and steak
Tableau runs an annual competition — Iron Viz. Three finalists, same dataset, 20 minutes to build live.
Ryan Sleeper won in 2013 and later wrote Practical Tableau, the book we’ll borrow most of today’s structure from. In his own telling, both competitors outclassed him (one on analysis, one on design). He won on something else.
Steak
data, analysis, design
+
Sizzle
story, motivation, delivery
When it was time to explain the dashboard, the other two walked through technical choices. Sleeper told the story behind the analysis.
A framework for the whole arc
Sleeper’s INSIGHT framework (from Practical Tableau, Part IV): seven steps that take you from a business question to work you’ve actually delivered.
I
Identify question
N
Name KPIs
S
Shape data
I
Initial concept
G
Gather feedback
H
Hone dashboard
T
Tell the story
First three letters are strategy. Next three are execution. The last one — T — is where most of today goes.
Step 1: Identify the question
I
N
S
I
G
H
T
One dashboard, one question
A dashboard that tries to answer everything usually ends up answering nothing clearly.
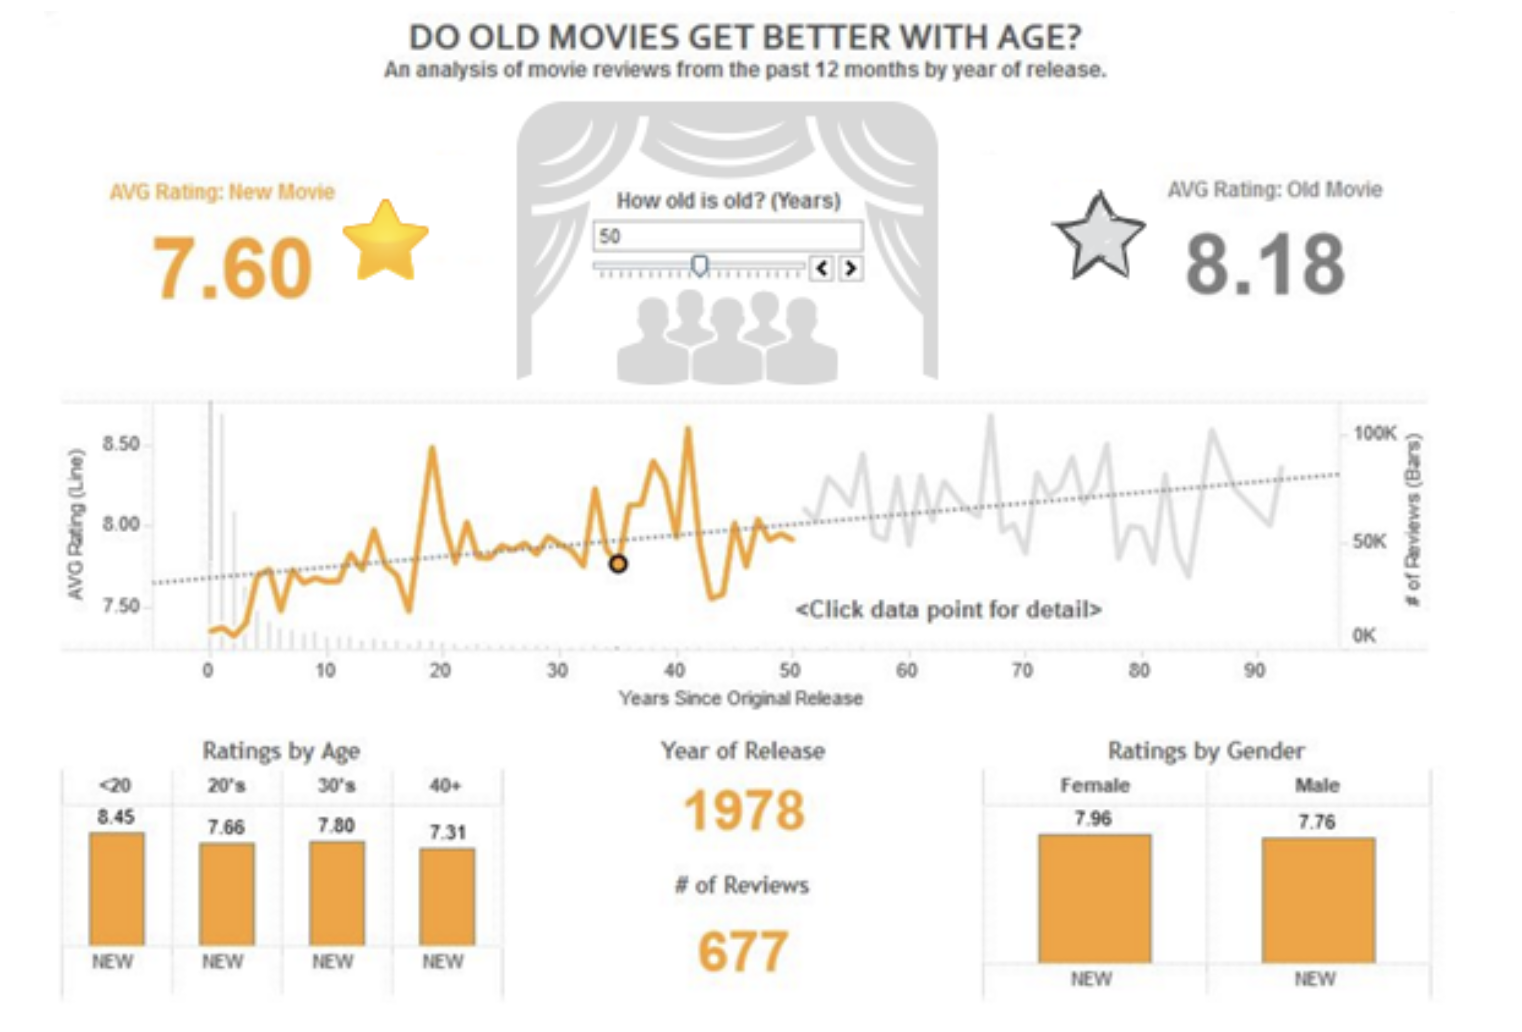
Sleeper’s running example is a dashboard titled:
Do Old Movies Get Better with Age?
Everything below the title is there to answer it.
The movie dashboard
Question at the top. Under it: average rating for new vs. old movies, a trend line with a slider, demographic breakdowns at the bottom. Every piece is there to answer the title.
From generic to sharp
A coffee shop chain asks for a sales dashboard. A stakeholder says:
“How are sales doing?”
Too vague. “Doing” compared to what? Which locations? Which products? No dashboard can answer a question this broad.
“Which product categories are driving the weekday afternoon sales dip at our downtown locations?”
Specific, answerable, short enough for a title.
Your turn: refine your question
Write down your current business question for your area.
Then apply the title test:
Does it fit in one line?
Would someone who’s never seen your project understand what you’re asking?
Is it specific enough that a different city’s data couldn’t answer it?
Any “no” means it needs another pass.
Step 2: Name the KPIs
I
N
S
I
G
H
T
Five or six, no more
Sleeper’s rule of thumb: five or six metrics at the top, no more. Past that and you haven’t decided what actually matters.
$3.2k
Weekday PM sales
−18%
vs. morning
42%
Category share: bakery
214
Tx per hour
Primary KPIs — always visible
SKU breakdown
customer segment
active promo
weather
staff on shift
avg basket
…
Secondary — tooltips & drill-downs
If everything is “key,” nothing is.
KPIs ladder up to the question
The movie dashboard asks: Do Old Movies Get Better with Age?
Three KPIs:
Age — the question’s central variable
Average rating — the measure of “better”
Number of reviews — the sample size check, because old movies have fewer reviews
Three metrics, each tied straight back to the question. Nothing else on the dashboard needs KPI-level prominence.
Back to the coffee shop
Question: “Which product categories are driving the weekday afternoon sales dip at our downtown locations?”
Primary KPIs
Sales by category × hour of day
Category share of total
Weekday vs. weekend comparison
Transactions per hour
Secondary metrics
SKU-level breakdown
Customer demographics
Active promotions
Weather conditions
Four primary KPIs answer the question. Everything else lives one click away.
Your turn: name your KPIs
For your area’s refined question, draft:
3-5 primary KPIs
Metrics that directly answer the question.
3-4 secondary metrics
Useful context for drill-downs or tooltips.
Compare with your teammates after the lecture. Align before building.
Step 3: Shape the data
I
N
S
I
G
H
T
Shape the data you have
Two parts to this step:
Layout — vertical tables, one field per column, one entry per row (Tidy Data from Week 3).
Transformation — find the fields you need, even if they aren’t obvious in the raw data.
Most of the fun is in the second part.
Finding age inside a movie title
Sleeper’s Iron Viz dataset didn’t have an age column. But the year of release was sitting right there in every title — a field hiding inside another.
Casablanca (1942)
→
extract year
1942
→
2026 − year
84
Shape the data to fit your question. When a field you need isn’t there, you can usually derive it.
Step 4: Initial concept
I
N
S
I
G
H
T
Sketch first
The temptation is to open Tableau and start dragging fields around.
Sleeper’s case: sketch on paper first. Boxes, labels, stick-figure level. No artistic skill required.
Two reasons:
It’s fast. Three layouts in ten minutes, easy.
It’s cheap to throw away. A critique of a sketch barely stings. A critique of a polished dashboard you’ve poured two evenings into — that one stings.
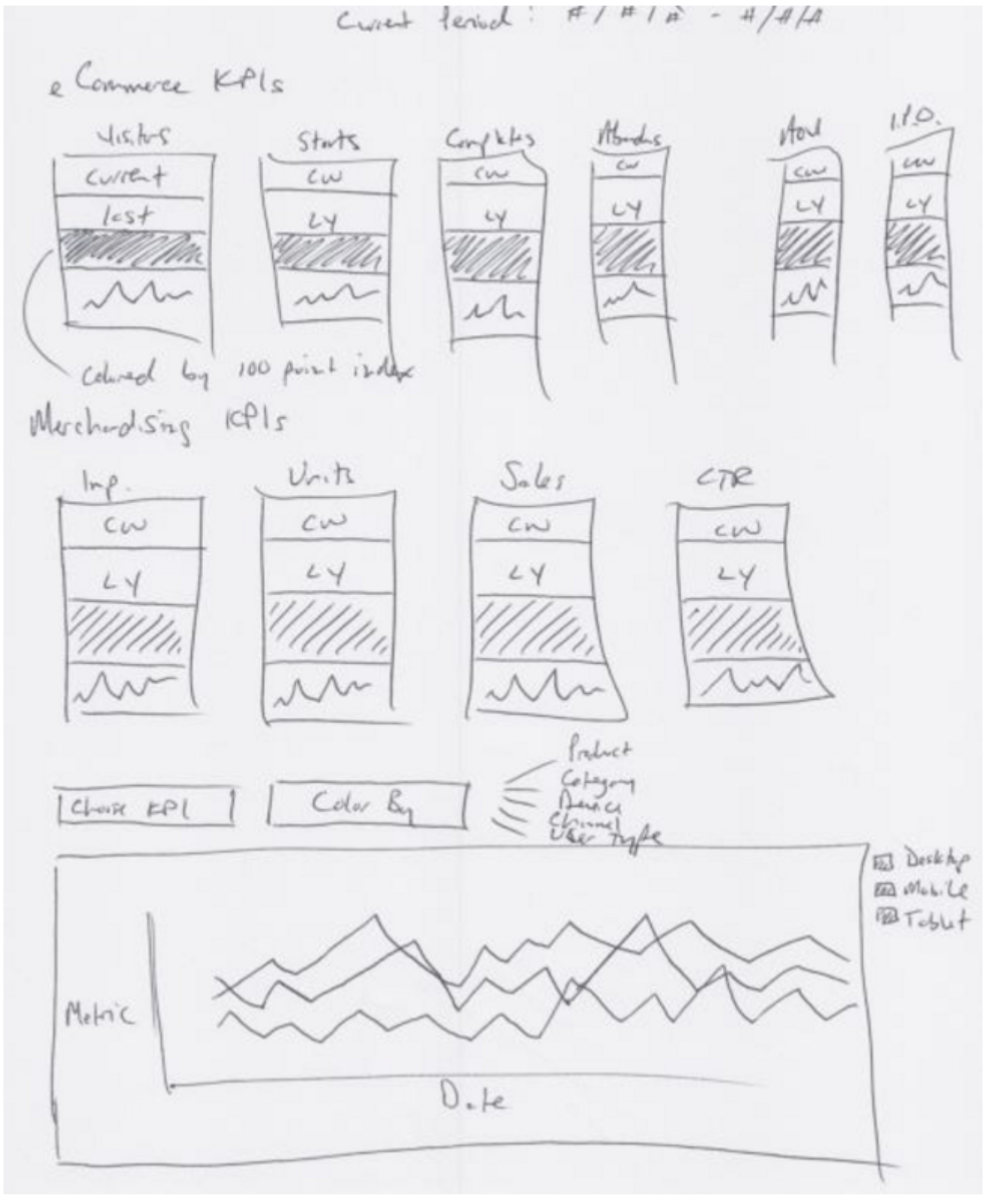
A real sketch
Sleeper’s planning sketch for an e-commerce dashboard. Boxes, labels, rough proportions. Current week vs. last year. Metric switcher at the bottom. Six KPIs at the top, four more below, a main trend chart at the bottom.
Audience and purpose drive the concept
Two questions to answer before you sketch:
Who is the audience?
What is the purpose?
For your project:
Audience — the presentation panel, your teammates, readers of the PDF
Purpose — answer the analytical area’s business question, with specific recommendations
A sketch for a C-suite audience looks nothing like one for fellow analysts. Know who’s on the other end before you draw a box.
Step 5: Gather feedback
I
N
S
I
G
H
T
Three reasons to get feedback early
Benefit
Why
Efficiency
Organized early feedback beats scattered late feedback
Reduced frustration
It’s easier to hear “change this” about a sketch than about a finished dashboard
Ownership
People who influenced the concept defend the final product
Build with your audience, not for them.
For the project: review inside the group
Your group is the feedback loop. You’re already sharing the data prep and the workbook — teammates will spot things a solo builder can’t.
Rotate sketches across the four members before anyone opens Tableau. One person sketches their page; the other three react.
Rotate again after the first build. Fresh eyes catch what the author no longer sees.
Before polishing, run the INSIGHT audit against each page with a teammate.
Collaboration inside the group is part of the project design. Workbooks, calculated fields, and the written analysis all stay inside the group.
Step 6: Hone the dashboard
I
N
S
I
G
H
T
Rules for the build phase
From PT Ch 82:
Dimensions match distribution. Printed handout = paper size. Laptop presentation = laptop resolution. Mobile = phone size.
12 components maximum. KPI cards, charts, filters — all counted. If you need more, split to another page.
Keep it simple. Chart selection, user experience, design. Obvious when said. Violated constantly.
If a view requires three sentences of explanation, it probably belongs in two views, not one.
When feedback conflicts with best practice
A stakeholder wants 15 pie charts. Best practice says no. What do you do?
Sleeper’s move: build both. The one they asked for, and the one you recommend. Let them compare. Let them decide.
You’re the final gatekeeper — but you’re also not the user. When you disagree, split the difference.
Step 7: Tell the story
I
N
S
I
G
H
T
Two ways to persuade
Robert McKee teaches screenwriting (his students include 60+ Academy Award winners). Harvard Business Review interviewed him specifically about business persuasion — why some pitches land and others don’t. He drew this distinction:
The first is conventional rhetoric — slides filled with bulleted facts and statistics. If you succeed in persuading them, you’ve done so on an intellectual basis. That’s not good enough, because people are not inspired to act by reason alone.
The second way is through story. Stories unite an idea with an emotion.
Three parts of a data story
Storytelling
Data work
Characters
Your KPIs and contextual metrics
Plot
The insights you uncovered
Narrative
How you communicate them
Your analytical work already has the first two. The third — narrative — is what the presentation brings.
A useful pattern: setup → conflict → resolution
Aristotle sketched a three-act shape for plays, and 2,400 years later it still works. Business presentations borrow it as a mental model — not a rule, just a way to think about flow.
Setup
Establish the situation. Introduce the audience’s stake in it.
Conflict
Show what the data reveals. Build tension between what is and what could be.
Resolution
Deliver the recommendation. Tie back to the setup.
Use it when it helps. Drop it when it doesn’t.
Narrative flow: two orders
Chronological
Walk through in the order you did it.
Problem → data → analysis → finding → recommendation.
Works when you need to establish credibility, or the audience cares about the process.
Lead with the ending
Start with the recommendation. Then back into the evidence.
Works when you already have the audience’s trust, or they care about “so what” more than process.
The power of repetition
The three shapes represent your three main points. Preview them up front, walk through each one, recap them at the end. The audience hears each point three times.
INTRO ▲ ● ■
▲
●
■
CONCLUSION ▲ ● ■
Bing — tell them what you’re going to tell them
Bang — tell them
Bongo — tell them what you just told them
Coffee shop opening: “We’ll cover what the sales dip looks like ▲, which categories are driving it ●, and what to do in the afternoon menu ■.”
To you it feels redundant. To the audience — hearing it for the first time — it feels helpful.
Four tests for story clarity
Before you present, run your deck through these:
Horizontal logic — read just the slide titles in order. Do they tell the story on their own?
Vertical logic — on each slide, does everything on it reinforce the title?
Reverse storyboarding — flip through the deck, write the main point of each slide. Does the list read like an outline?
Fresh perspective — show the deck to someone with no context. What do they think the story is?
Wherever one of these fails, that’s where your narrative needs work.
Worked example (if time permits)
The setup
Cole Knaflic has a full worked example in Storytelling with Data, Chapter 8.
The scenario: you work for a startup. The team needs to price a new consumer product, and you have seven years of competitor pricing to work with.
The Big Idea — the analysis in one sentence:
Based on analysis of pricing in the market over time, to be competitive, we recommend introducing our product at a retail price in the range \(ABC–\)XYZ.
Let’s open Chapter 8 together
We’ll skim it together. As we go, watch for:
The first chart. Notice what’s wrong with it — the colors, the axes, the title that doesn’t match the visual.
The stripping process. Each iteration removes something. Track what’s lost and what starts to appear.
The story build. Once the chart is clean, the same chart shows up six more times with different emphasis. Notice what changes each time.
The final slide. How does it tie back to the Big Idea?
The data never changes. The delivery does.
What to export to your project
Four things worth carrying back:
State the Big Idea first. One sentence that names the audience, the finding, and the recommendation. Write it before you design any slide.
Strip the chart to its essentials. Pull out anything that isn’t carrying information. The clean chart is your canvas.
Reveal only what the current slide needs. Same chart, different emphasis each time. Hide the lines that aren’t part of this moment.
Close by tying back to the Big Idea. The last slide answers the question the first slide raised.
One chart used eight times with different emphasis beats eight different charts every time.
The Iron Viz winner’s edge
Sleeper’s two competitors spent their explanation time on the technical side — how the calculation worked, why they picked the chart type, where they placed the filter.
Sleeper told the story of why he was curious about old movies in the first place.
For your defense: the panel already has the PDF. They know what you built. Tell them why you built it, and what it means.
Deadlines
Assignment 5 — due end of this week
Group project workbook + PDF + data prep scripts — due day before Week 8 presentations
Individual defense — mandatory at the presentation
See group-project.qmd for the detailed rubric.
What to take away
A single question at the top. If it needs qualification, it’s not the question yet.
Five or six KPIs. If everything is key, nothing is.
Sketch before you build. Cheap to throw away.
Feedback before polish. Protect the quality of the feedback you get.
Stories stick. Statistics don’t — 63% vs. 5%.
Tell them why you built it, and what it means. Skip the technical tour.